Tracking Pathogen Variants with Untargeted Wastewater Metagenomics
Aggregating reads across sites recovers national pathogen variant dynamics for norovirus and SARS-CoV-2
Thanks to Chris Doering, Jeff Kaufman, and Jacqueline Chretien for their review of this post.
In collaboration with the CASPER consortium, we generate deep, untargeted wastewater metagenomic sequencing (WW-MGS) data from sewersheds across the U.S., a large majority of which we make publicly available. Two key features of our approach are that it:
- Returns sequence information rather than a presence/absence call, enabling genomic analyses.
- Is pathogen-agnostic, enabling us to monitor hundreds of pathogen targets in a single assay.
A tradeoff of this pathogen agnosticity is lower coverage. Vertebrate-infecting virus sequences typically make up only 0.01% of reads. We partly offset this by sequencing deeply, around a billion read pairs per sample, but per-pathogen coverage in any single sample remains low. This is especially true for respiratory viruses, which shed less into wastewater than enteric ones: for example, the median number of SARS-CoV-2 read pairs in a public CASPER sample is 33, versus 6,173 for norovirus.
We’ve shown previously that despite the low coverage, normalized read counts track clinical and wastewater PCR trends well. But it’s unclear whether this lower coverage supports sub-species analyses, which can be used to monitor the emergence and spread of new variants; these kinds of analyses are well-established for (semi-) targeted platforms like amplicon and hybrid-capture wastewater sequencing but are harder to apply at the sample or site level for untargeted WW-MGS.
However, by aggregating sequence data across sites, we’re nevertheless able to recover a reasonable picture of national lineage and genotype dynamics. Here, we’ve pooled reads across CASPER sites and examined lineage and genotype changes over time for SARS-CoV-2 and norovirus, respectively, comparing each against CDC pathogen surveillance data.
What we see
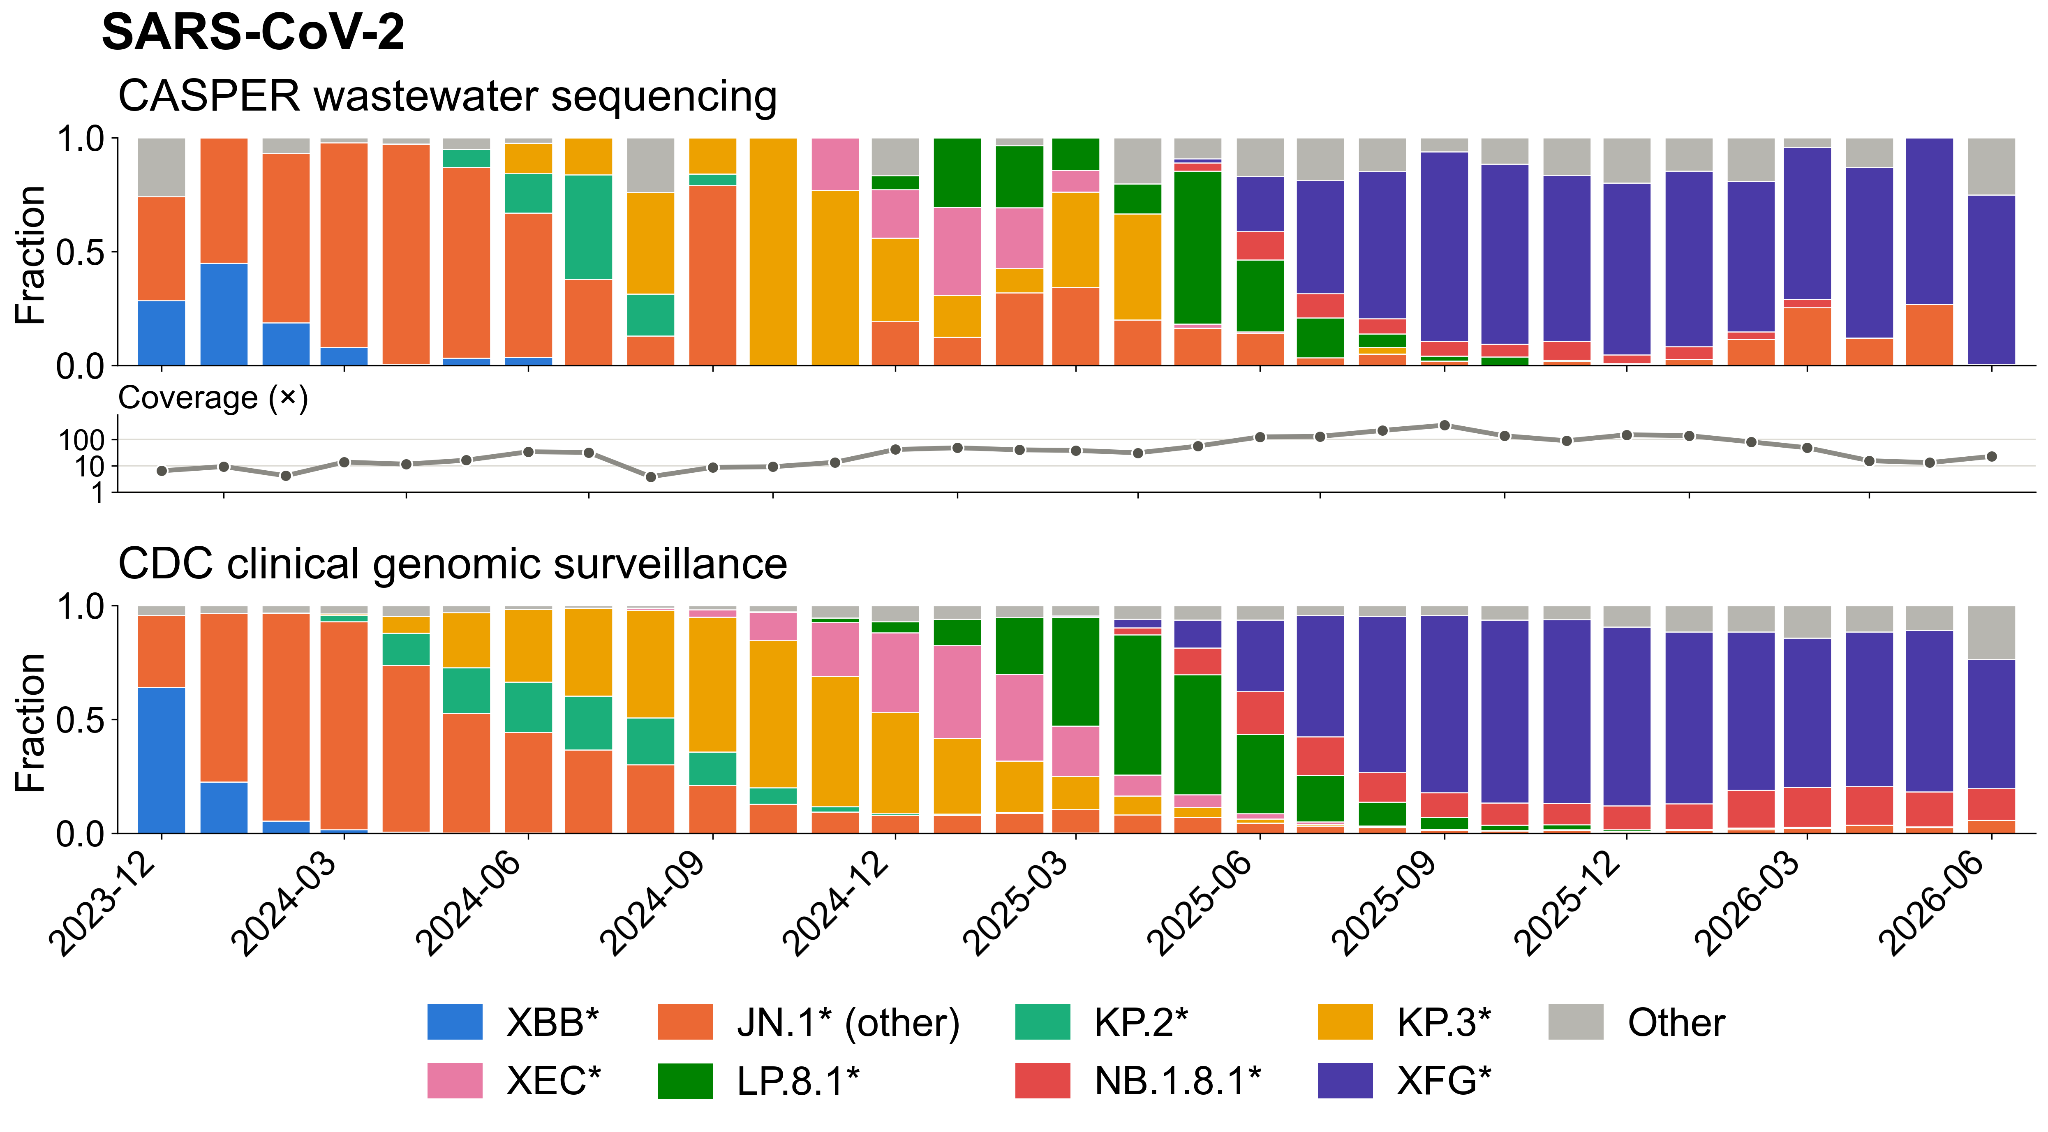
Figure 1. Top: SARS-CoV-2 lineage composition estimated from CASPER wastewater data, pooled monthly across sites. Middle: mean sequencing depth across the SARS-CoV-2 genome for each monthly pool. Bottom: CDC clinical genomic surveillance for the same time period.
Figure 1 compares the SARS-CoV-2 lineage composition estimated with Freyja from CASPER data (with reads pooled by month across all sites) against CDC clinical genomic surveillance. CASPER recovers the successive transitions from JN.1 to KP.3 and eventually XFG, with each shift arriving at roughly the same time as in the clinical data. The composition is noisier in CASPER than in the clinical series, particularly in earlier months when only a handful of CASPER sites were online, and it does not resolve circulating strains at the same granularity.
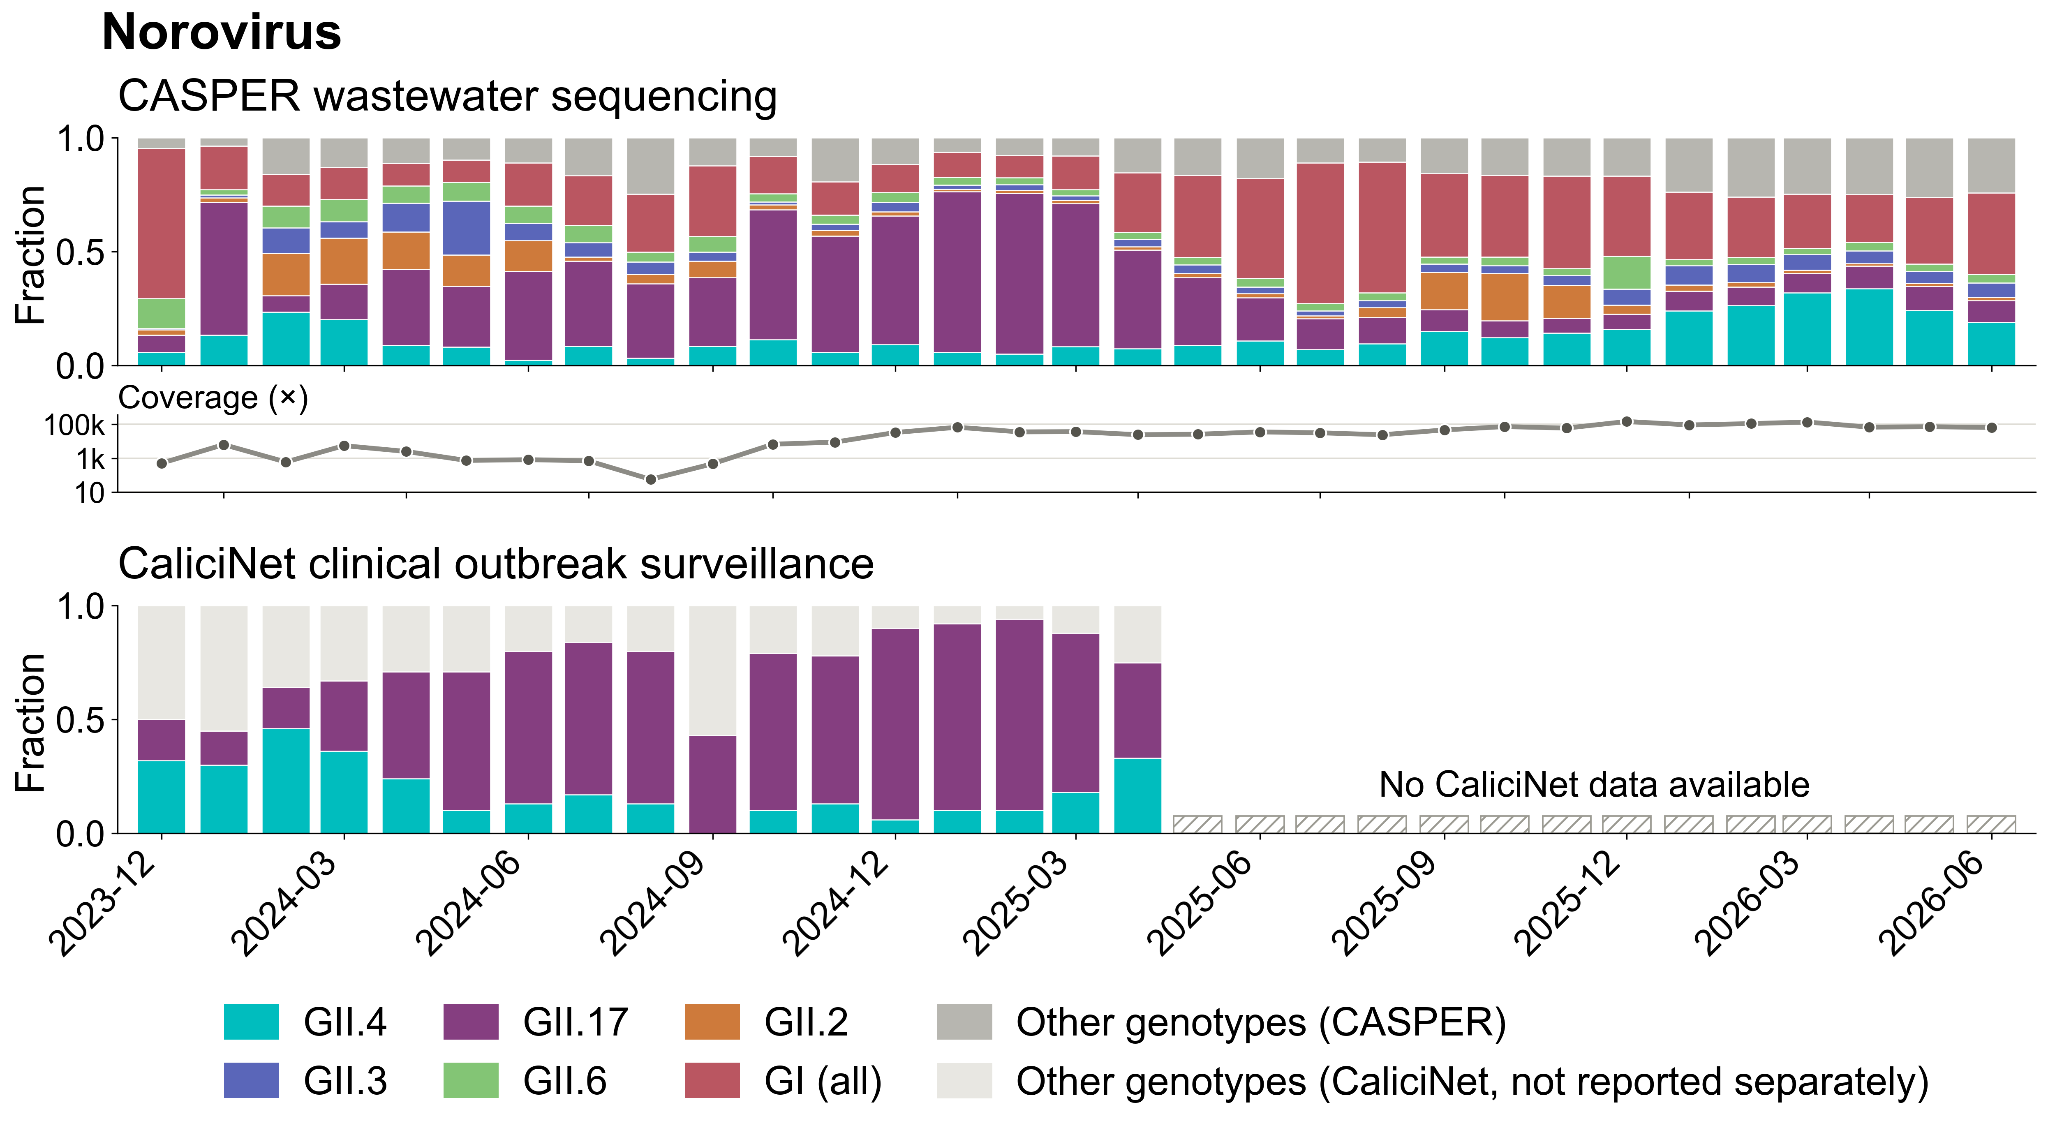
Figure 2. Top: Norovirus capsid genotype composition from CASPER wastewater data. Middle: mean sequencing depth across the VP1 capsid region used for genotyping for each monthly pool. Bottom: CaliciNet outbreak surveillance for 2024–25.
Figure 2 compares the norovirus capsid genotype composition determined from CASPER data against CDC CaliciNet outbreak surveillance published in Barclay and Vinjé (2025), which reports the proportion of norovirus outbreaks attributed to GII.4, GII.17, and “other” genotypes (not broken out separately). Norovirus is roughly two orders of magnitude more abundant than SARS-CoV-2 in the WW-MGS data, so genotype analysis often works at the level of individual samples or sites, though we aggregate reads here in the same way as SARS-CoV-2 for comparability. CASPER data corroborate the rise of GII.17 relative to GII.4 through the 2024–25 season, though both genotypes account for a smaller share of the total in the wastewater data than in CaliciNet. This is most likely because CaliciNet counts only recognized outbreaks, whereas CASPER captures shedding that may never meet that threshold. GII.4 and GII.17 dominate among recognized outbreaks, as they transmit efficiently person to person, whereas GI is more often implicated in point-source food and waterborne events, which are less likely to be recognized and reported.
Conclusion
WW-MGS is a powerful, pathogen-agnostic detection platform, but its greater agnosticity comes at the cost of lower coverage compared to more targeted alternatives like hybrid-capture or amplicon sequencing. Here, we show that despite low per-sample coverage, national WW-MGS data from CASPER can be aggregated to enable variant-level tracking of SARS-CoV-2 and norovirus. This approach could be extended to many more pathogens captured by wastewater, providing a more comprehensive overview of pathogen dynamics in human, animal, and plant populations.
Methods
We extracted read pairs assigned to SARS-CoV-2 and to norovirus by the SecureBio Viral Metagenomics Pipeline from public CASPER samples (PRJNA1247874). Reads were not deduplicated.
For SARS-CoV-2, available reads across all CASPER sites within each calendar month were pooled and aligned to the Wuhan-Hu-1 reference genome (NC_045512.2) with Bowtie2, and lineage abundances were estimated with Freyja v2.0.0 (UShER barcodes downloaded 2026-09-01).
For norovirus, reads were aligned against reference sequences from the CDC Human Calicivirus Typing Tool (HuCaT), the panel that CaliciNet uses to type outbreak specimens, and filtered to near-complete VP1 (≥1,400 bp), giving 228 references across 37 genotypes. Each read pair was assigned to the genotype whose best-scoring reference beat that of every other genotype by at least 10 alignment-score points. Pairs without a clear winner were considered ambiguous (1.6% of aligned pairs) and excluded. Genotype fractions were pooled monthly across sites to match the SARS-CoV-2 analysis.
For comparison, we used SARS-CoV-2 variant proportions from the CDC SARS-CoV-2 Variant Proportions dataset, and norovirus genotype proportions from monthly CaliciNet outbreak percentages in Barclay and Vinjé (2025).
Code to reproduce these plots and public portions of the analysis is available at https://github.com/securebio/casper-variant-tracking.